Design Process
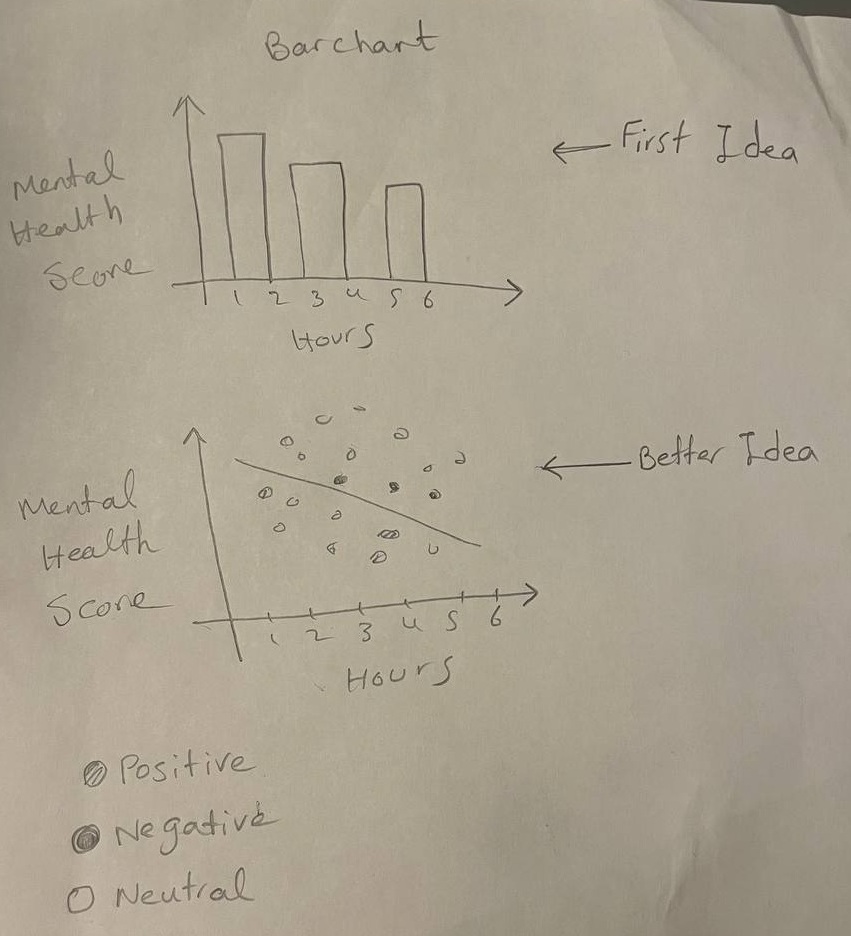
At first, I intended to create only a Bar Chart to display the data. But after carefully examining the data and analyzing the relationships between variables, I realized that a Scatter Plot could better show the relationship between daily usage hours, sleep quality, and mental health score, and make hidden trends in the data clearer.
To better understand the impact of users' emotions, I used colors:
- Green: Positive results (Positive)
- Yellow: Neutral results (Neutral)
- Red: Negative results (Negative)
This choice of colors allowed the user to quickly identify which points on the chart represent positive or negative effects on mental health, and made comparison between variables easier.
Initial Sketch
This is my initial hand-drawn sketch of the visualization design:
Focus on User Experience (UX)
Choosing a Scatter Plot and bright color coding makes the data understandable and analyzable for the user. The goal was for the user to observe trends and relationships without confusion and make more accurate conclusions.
Use of Visualization
Using a Scatter Plot and interactive color coding, I was able to answer the main project questions and clearly show the relationships between variables:
Comparison of mental health with daily usage hours
The more time spent on social media, the higher the likelihood of a decrease in Mental Health Score. Users with long-term usage usually report higher levels of anxiety and depression.
Impact of sleep quality
Less and insufficient sleep is one of the main factors reducing mental health. Excessive social media use before sleep reduces sleep quality and duration, lowering energy, focus, and mood.
Impact of platforms
Platforms like Instagram and TikTok have the most negative effect on mental health because they encourage social comparison and feelings of inadequacy. Text or messaging platforms like WhatsApp or Telegram have less negative impact because they are mainly used for direct social communication rather than life display.
Interactive features
Using interactive buttons allowed the user to switch between features, and the chart displayed accurate and clear values each time. The color coding of chart points (green, yellow, red) allowed quick identification of positive, neutral, and negative effects.
This visualization enables the user to easily observe hidden trends and relationships between usage hours, sleep quality, and mental health, and documents data analysis visually.
Main Question
Does social media use affect mental health?
Yes, research shows that excessive social media use can have a negative impact on mental health. Studies have shown that heavy social media interaction is associated with increased anxiety, depression, and reduced life satisfaction. However, negative or positive effects can depend on the type of use, platform, and individual characteristics of the user.
Sub-questions
Relationship between daily usage hours and Mental Health Score
The more daily social media use, the more likely the Mental Health Score decreases. Users with long-term usage usually report higher levels of anxiety and depression. However, moderate and balanced use may not have a negative impact, and some studies even show that purposeful and positive use can have social and supportive benefits.
Does less sleep reduce mental health?
Yes, less and insufficient sleep is one of the main factors reducing mental health. Excessive social media use before sleep reduces sleep quality and duration, lowering energy, focus, and mood, and increasing anxiety and depression.
Which platform has the most negative effect?
According to various studies, platforms that focus more on social comparison and showing an ideal life, like Instagram and TikTok, have the most negative effect on mental health. These platforms cause users to compare themselves to others, feel inadequate, and have lower life satisfaction. Text or messaging platforms like WhatsApp or Telegram have less negative impact because they are mainly used for direct social communication rather than life display.